Diagrams画直方图————Plot补完计划(一) - TBY's Blog
Diagrams画直方图————Plot补完计划(一)
这是个蛋疼系列,计划用Diagrams实现所有常用的统计绘图,目的主要是扩充自己的工具箱,绘图时能够摆脱外部的统计软件,并且能根据实际数据需要,方便地自定义修改。代码风格的话,属于想到啥写啥,不会太严谨。
用Diagrams画过一些矢量图以后,发现真正麻烦的地方不是“图形”本身,而是字体、数轴、缩放比例,这些琐碎的东西反而会占据90%以上的代码。以直方图为例,图形本身很简单,差不多1~2行能搞定(第18、19行)。
import           Data.Colour
import           Data.Colour.Names
import qualified Data.Vector.Generic as GV
import qualified Data.Vector.Unboxed as UV
import           Diagrams.Backend.Cairo.CmdLine
import           Diagrams.Prelude
import           Statistics.Distribution
import           Statistics.Distribution.Normal
import qualified Statistics.Sample.Histogram as H
import           System.Random.MWC
import qualified System.Random.MWC.Distributions as R
import           Text.Printf

histogram nBin c vec =
  let (low,up) = H.range nBin vec
      w = (up - low) / fromIntegral nBin
      v = H.histogram_ nBin low up vec ::  UV.Vector Double
      his = alignBL . hcat . map (safeRect w) . GV.toList $ v -- 直方图
      maxH = UV.maximum v
      factorX = maxH / (ratio * (up - low)) -- ratio,图最后的宽:高的比例
      fontS = maxH / 20 -- 字体大小
  in (yAxis maxH fontS ||| strutX (fontS/2) |||
      (his # scaleX factorX === strutY (fontS/2) ===
       xAxis low up fontS factorX))
     # centerXY
  where
    safeRect w h = if h /= 0 -- 0.6版本rect函数,h==0时会报错
                   then rect w h
                        # alignB
                        # fcA c
                   else hrule w
                        # alignB
麻烦的地方开始了,你需要图形的数轴自动标上合适的Label吧,需要图形能自动根据自身的长宽比选择一个合适的缩放比例吧。我发现下面这个unit函数可以比较好的自动选择数轴单位,不会使ticks太密集或者稀疏。fmtStr是和printf配合使用,选择一个合适的数字格式。如此,数轴的其他部分绘制基本就无难度了。
unit :: (Ord a,Floating a) => a -> a -> a
unit low up = last $
              takeWhile (\c -> (up - low) / c >= 4.5) $
              takeWhile (<= (up - low)) $
              concatMap (\c ->  map (10^^c *) [1,2,5])  ([-4..]::[Int])
{-# INLINABLE unit #-}

fmtStr low up | up - low >= 5 = "%.0f"
              | up - low >= 0.5 = "%.1f"
              | up - low >= 0.25 = "%.2f"
              | up - low >= 0.125 = "%.3f"
              | otherwise = error "too small interval"
因为实际应用的时候,往往会用数据做个期望最大化估计,得到一个理论分布的概率密度函数来做比较,可以再在histogram函数上略做修改,添加绘制概率密度函数的代码部分。这块麻烦的地方主要在于计算概率密度函数的缩放比例。
histogram' nBin (vec,c) (d,c') = -- d : Statistics.Distribution中的Distribution
  let (low,up) = H.range nBin vec
      w = (up - low) / fromIntegral nBin
      v = H.histogram_ nBin low up vec ::  UV.Vector Double
      n = fromIntegral $ GV.length vec
      his = alignBL . hcat . map (safeRect w) . GV.toList $ v
      ls = [low,low+w/2..up]
      maxH = UV.maximum v
      factorX = maxH / (ratio * (up - low))
      fontS = maxH / 20
      vs = fromVertices $ map p2 $ zip ls $ map ((f *) . (density d)) ls
      f = w * n / (cumulative d up - cumulative d low) -- 总面积 / cdf跨过的面积
      funP = vs # stroke # lw (fontS/10) # lcA c' # moveOriginTo (p2 (low,f*(density d low))) -- 与直方图的原点对齐
  in (yAxis maxH fontS ||| strutX (fontS/2) |||
      ((funP <> his) # scaleX factorX === strutY (fontS/2) ===
       xAxis low up fontS factorX))
     # centerXY
  where
    safeRect w h = if h /= 0
                   then rect w h
                        # alignB
                        # fcA c
                   else hrule w
                        # alignB
绘制效果:

所有代码如下:
{-# LANGUAGE NoMonomorphismRestriction #-}
{-# OPTIONS_GHC -fno-warn-missing-signatures #-}
-----------------------------------------------------------------------------
-- |
-- Module : 一些柱状图相关便利函数
-- Copyright : (c) 2012 Boyun Tang
-- License : BSD-style
-- Maintainer : tangboyun@hotmail.com
-- Stability : experimental
-- Portability : ghc
--
--
--
-----------------------------------------------------------------------------
module Main where

import           Data.Colour
import           Data.Colour.Names
import qualified Data.Vector.Generic as GV
import qualified Data.Vector.Unboxed as UV
import           Diagrams.Backend.Cairo.CmdLine
import           Diagrams.Prelude
import           Statistics.Distribution
import           Statistics.Distribution.Normal
import qualified Statistics.Sample.Histogram as H
import           System.Random.MWC
import qualified System.Random.MWC.Distributions as R
import           Text.Printf

ratio = (sqrt 5 - 1) / 2

histogram' nBin (vec,c) (d,c') =
  let (low,up) = H.range nBin vec
      w = (up - low) / fromIntegral nBin
      v = H.histogram_ nBin low up vec ::  UV.Vector Double
      n = fromIntegral $ GV.length vec
      his = alignBL . hcat . map (safeRect w) . GV.toList $ v
      ls = [low,low+w/2..up]
      maxH = UV.maximum v
      factorX = maxH / (ratio * (up - low))
      fontS = maxH / 20
      vs = fromVertices $ map p2 $ zip ls $ map ((f *) . (density d)) ls
      f = w * n / (cumulative d up - cumulative d low)
      funP = vs # stroke # lw (fontS/10) # lcA c' # moveOriginTo (p2 (low,f*(density d low)))
  in (yAxis maxH fontS ||| strutX (fontS/2) |||
      ((funP <> his) # scaleX factorX === strutY (fontS/2) ===
       xAxis low up fontS factorX))
     # centerXY
  where
    safeRect w h = if h /= 0
                   then rect w h
                        # alignB
                        # fcA c
                   else hrule w
                        # alignB


histogram nBin c vec =
  let (low,up) = H.range nBin vec
      w = (up - low) / fromIntegral nBin
      v = H.histogram_ nBin low up vec ::  UV.Vector Double
      his = alignBL . hcat . map (safeRect w) . GV.toList $ v -- 直方图
      maxH = UV.maximum v
      factorX = maxH / (ratio * (up - low)) -- ratio,图最后的宽:高的比例
      fontS = maxH / 20 -- 字体大小
  in (yAxis maxH fontS ||| strutX (fontS/2) |||
      (his # scaleX factorX === strutY (fontS/2) ===
       xAxis low up fontS factorX))
     # centerXY
  where
    safeRect w h = if h /= 0 -- 0.6版本rect函数,h==0时会报错
                   then rect w h
                        # alignB
                        # fcA c
                   else hrule w
                        # alignB

xAxis low up fSize factorX =
  let ls = takeWhile (<= len) [beginAt,beginAt + step..]
      beg = fromIntegral $ (ceiling low :: Int)
      ls' = take (length ls) [beg,beg+step..]
      len = up - low
      step = unit low up
      beginAt = beg - low
      fmt = fmtStr beginAt (last ls)
      ticks = map (\l ->
                    alignT $
                    (vrule (fSize/3) # lw (fSize/20) === strutY (fSize/2) ===
                     text' fSize (printf fmt l))
                  ) ls'
      vs = map p2 $ zip (map (* factorX) ls) (repeat 0)
  in (hrule len # lw (fSize / 10) # alignL) # scaleX factorX <>
     position (zip vs ticks)

yAxis maxH fSize =
  let step = unit 0 maxH
      ls = takeWhile (<= maxH) [step,step+step..]
      fmt = fmtStr step (last ls)
      vs = map p2 $ zip (repeat 0) ls
      ticks = map (\l ->
                    alignR $
                    (text' fSize (printf fmt l) ||| strutX (fSize/2) |||
                     hrule (fSize/3) # lw (fSize/20))
                  ) ls
  in vrule maxH # lw (fSize / 10) # alignB <>
     position (zip vs ticks)


text' h t = text t # fontSize h <> rect (fromIntegral (length t) * 0.6 * h) h # lcA transparent

unit :: (Ord a,Floating a) => a -> a -> a
unit low up = last $
              takeWhile (\c -> (up - low) / c >= 4.5) $
              takeWhile (<= (up - low)) $
              concatMap (\c ->  map (10^^c *) [1,2,5])  ([-4..]::[Int])
{-# INLINABLE unit #-}

fmtStr low up | up - low >= 5 = "%.0f"
              | up - low >= 0.5 = "%.1f"
              | up - low >= 0.25 = "%.2f"
              | up - low >= 0.125 = "%.3f"
              | otherwise = error "too small interval"

main = do
  gen <- create
  randVec <- UV.replicateM 100000 (R.standard gen)
  defaultMain $ do
    histogram' 100 (randVec,blue `withOpacity` 0.8) (normalFromSample randVec, green `withOpacity` 0.8)
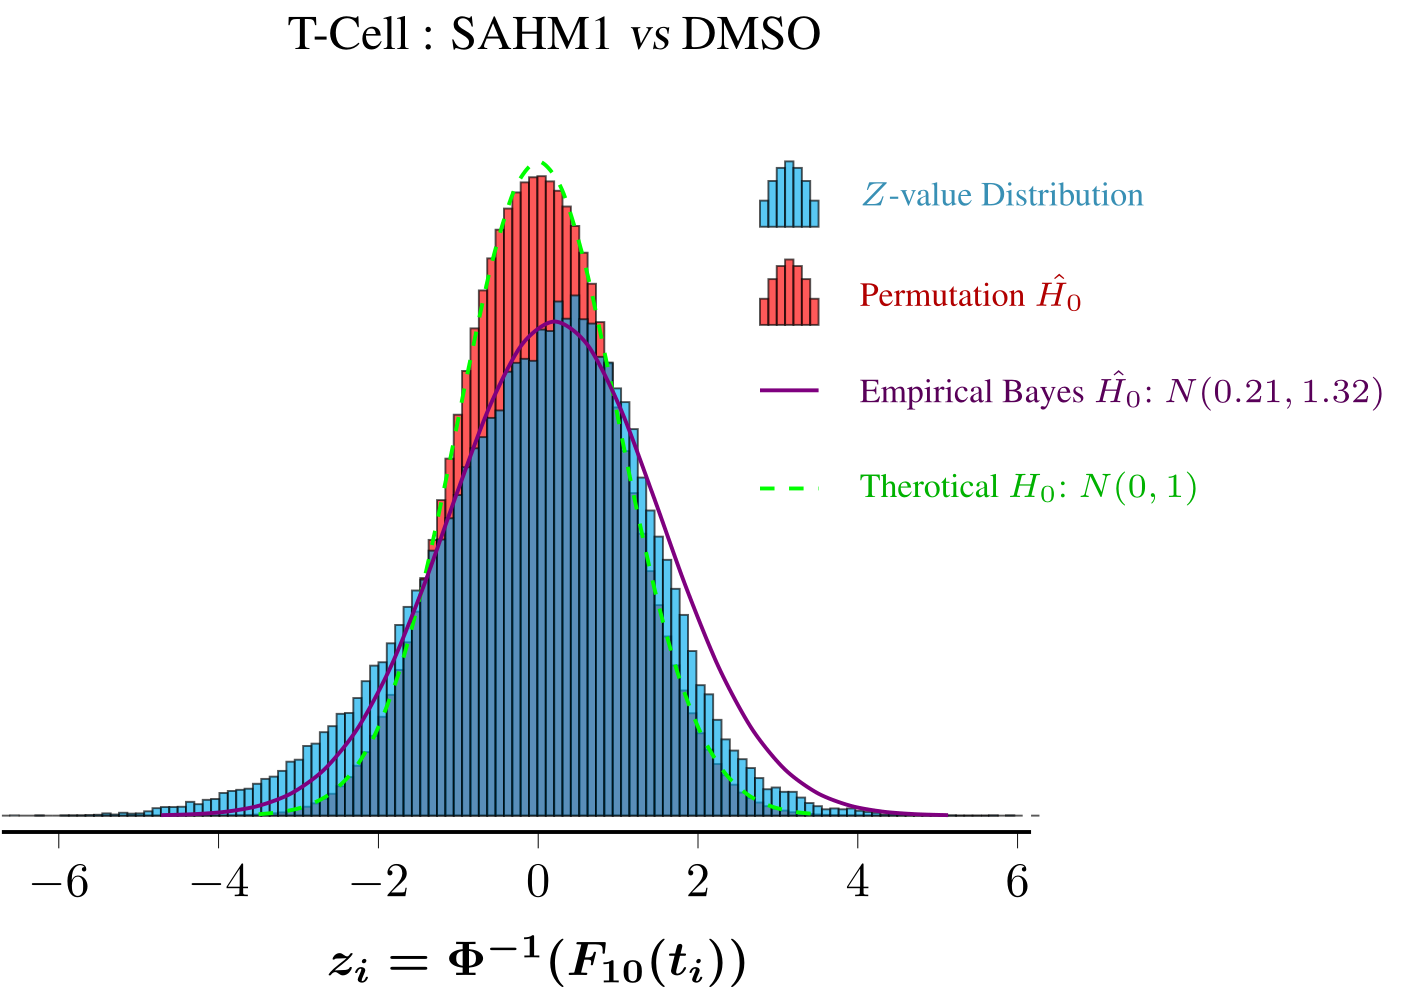
后记:Statistics.Sample.Histogram中的两个histogram函数接口不是很好用,如果只画一层直方图无疑是足够的,但是统计绘图里有时候需要绘制2层直方图(比如实际数据一层、permutation test产生的一层,再加上个经验贝叶斯估计的函数,如下图),它的接口两套数据无法共用一个bin。。。还不如自己写。。。Diagrams目前最大的软肋还是字体处理,这点上估计是没希望超越LaTeX+pgfplots的,下图的其他效果都容易做到,唯独数学字体。。。。。
2012年12月11日 22:47
这东西 ArchHaskell 源里没有啊 :-(
2012年12月11日 23:02
@依云:
项目的主页:http://projects.haskell.org/diagrams/gallery.html
这库的core很精简,api设计的不错。haskell的2D绘图相关库不少,我觉得这个最有前途。
2012年12月11日 23:17
@TBY: 项目主页我能找到。关键是 Haskell 的依赖太烦了,一个库更新 break 掉 N 多个,甚至还出现循环依赖。所以我现在都不自己打包了,源里没有就算了。
哦还有,我本地的文档好像也坏掉了,更新时出错,可能缺一些库的文档 :-(
2012年12月11日 23:41
@依云:
确实,这个库我是直接github上拉下来的0.6版,hackage上0.5版本(0.6版本这个月据说会release)ghc7.6 build会挂在transformer这的。文档默认的~/.cabal/config里documentation是关着的,可以check下。
arch源里的,除了gtk那系列的,其他我基本还是自己cabal装的。haskell的cabal依赖我已经被无数次恶心过了。现在已经可以立马面无表情的随便 rm -rf ~/.ghc了。。。
当然吃得消的话可以每个小文件都写个.cabal然后cabal-dev install。
2012年12月11日 23:47
@TBY: 好吧……ccache 对 cabal 的编译有效不?cabal 的文件存放路径可配置不?
2012年12月11日 23:56
@依云: 木有做过这方面的尝试,因为我经常需要找个接口偷懒。。。
2012年12月12日 16:50
diagrams 0.6版今天release了,http://hackage.haskell.org/package/diagrams-0.6
2012年12月12日 18:50
@TBY: 然后一朋友告诉我他的程序找不到 ....Cairo.Cmdline 模块了……
2012年12月13日 13:44
@依云: 很好……cairo那个包接口是有变动,好像是要把对gtk的依赖移除。
2022年8月25日 18:03
HP Board 11th Class Important Model Question Paper 2023 PDF will be Published on the Official web Portal. Himachal Pradesh 11th Class Important Model Question Paper 2023 and Marking Schemes PDF are Given Below. Important Model Question Paper 2023 are Significant Study Materials in the Exam Preparation Process. Himachal Pradesh 11th Question Paper 2023 Science, Geography, Sociology, Psychology, and Other Subjects Important Model Question Paper 2023 Details are Provided on This Page. for More Details About the Himachal Pradesh 11th Class Important Model Question Paper 2023 and Important Model Question Paper 2023 Kindly Visit the Official Website.