Haskell - TBY's Blog
相关矩阵的求解的一些优化心得
问题如下,有 [tex]n \times m [/tex]Matrix, where [tex] n > 10^4 [/tex] , [tex] m[/tex] ~ [tex]100[/tex],以Row-major order 存储于内存中,需要求 相关矩阵 [tex]M_{cor}[/tex]。由于相关矩阵是对称的,所以只需要求上半个矩阵,共 [tex]p = \frac{(n-1)n}{2}[/tex]次相关系数求解。求解计算本身很简单无外乎:
  for(int i=0;i<r;i++)
    for(int j=i+1;j<r;j++)
    {
      double r = correlation(row(i),row(j));
    }
(0,1),(0,2),(0,3) ... (1,2),(1,3) ... (2,3),(2,4) ...
然后再以如下方式并发(以4核为例):
// thread 1 :
for (int idx = 0; idx < (n-1)*n/2; idx=idx+4) {
   (i,j) = calc(idx);
   double r1 = correlation(row(i),row(j));
}

// thread 2 :
for (int idx = 1; idx < (n-1)*n/2; idx=idx+4) {
   (i,j) = calc(idx);
   double r2 = correlation(row(i),row(j));
}

// thread 3 :
for (int idx = 2; idx < (n-1)*n/2; idx=idx+4) {
   (i,j) = calc(idx);
   double r3 = correlation(row(i),row(j));
}

// thread 4 :
for (int idx = 3; idx < (n-1)*n/2; idx=idx+4) {
   (i,j) = calc(p);
   double r4 = correlation(row(i),row(j));
}
好了,所以重点在于如何以并不高的代价解出那个calc函数。想了一下,直接要 idx -> (i,j) 不太容易,先反过来如何从(i,j) -> idx,草稿纸推了下(我小学数学老师要哭了,推了蛮长时间),idx满足以下等式:
#include <stdio.h>
int main(int argc, char *argv[])
{
  int n = 10;
  int i,j;
  int idx = 0;
  for(i=0;i<n;i++)
    for(j=i+1;j<n;j++)
    {
      int p = (n*(n-1) - (n-1-i)*(n-i))/2 + j - i - 1;
      int q = (2 * i * n - i * i - 3 * i + 2 * j - 2) / 2;
      printf("%d  %d  %d\n",p,q,idx);
      ++idx;
    }
  return 0;
}
testIdx :: Int -> Int -> Int -> Bool
testIdx i j idx = (2*i*n-i*i-3*i+2*j-2) == idx * 2
f1 :: Int -> Int -> (Int,Int)
f1 n idx = head [(i,j) | i <- [0..n-2],
                         j <- [i+1..n-1],
                         testIdx i j idx]
f2 :: Int -> Int -> (Int,Int)
f2 n idx = -- quot开销比div更小, Haskell中的div比quot多额外的检查项,这里都是正整数运算无此必要
  let i = getI idx
      j = getJ i idx
  in (i,j)
  where
    getJ :: Int -> Int -> Int
    getJ i p = (2*p+i*i+3*i-2*i*n+2) `quot` 2
    getI :: Int -> Int
    getI ix = length (takeWhile (<= ix) ps0) - 1
    ps0 :: [Int] -- 上对角元素对应的idx值
    ps0 = map (\i -> (2*i*n-i*i-i) `quot` 2) [0..n-2]
import qualified Data.Vector.Unboxed as UV
getVec :: Int -> UV.Vector Int
getVec n = UV.generate n (\i -> (2*i*n-i*i-i) `quot` 2)


f3 :: UV.Vector Int -> Int -> (Int,Int)
f3 vec idx =
  let i = getI
      j = getJ i
  in (i,j)
  where
    n = UV.length vec
    getJ i = (2*idx+i*i+3*i-2*i*n+2) `quot` 2
    getI = go 0
      where
        go acc | acc == n - 1 = acc
               | otherwise = if UV.unsafeIndex vec  (acc+1) > idx
                             then acc
                             else go (acc+1)
import Criterion.Main
import qualified Data.Vector.Unboxed as UV

f1 :: Int -> Bool
f1 n =
  let l = (n * (n-1)) `quot` 2
      ls = [0..l-1]
  in and $ zipWith (==) ls $ map (\p -> head [getP i j | i <- [0..n-2],j <- [i+1..n-1],testP i j p]) ls
  where
    testP :: Int -> Int -> Int -> Bool
    testP i j p = (2*i*n-i*i-3*i+2*j-2) == p * 2
    getP :: Int -> Int -> Int
    getP i j = (2*i*n-i*i-3*i+2*j-2) `quot` 2

f2 :: Int -> Bool
f2 n =
  let l = (n * (n-1)) `quot` 2
      ls = [0..l-1]
  in and $
     zipWith (\a b -> a == b) ls $
     map (\p ->
           let i = (length $ takeWhile (<= p) ps0) - 1
               j = getJ i p
           in getP i j) ls
  where
    getP :: Int -> Int -> Int
    getP i j = (2*i*n-i*i-3*i+2*j-2) `quot` 2
    getJ :: Int -> Int -> Int
    getJ i p = (2*p+i*i+3*i-2*i*n+2) `quot` 2
    ps0 :: [Int]
    ps0 = map (\i -> (2*i*n-i*i-i) `quot` 2) [0..n-2]


f3 :: UV.Vector Int -> Int -> Bool
f3 vec n =
  let l = (n * (n-1)) `quot` 2
      ls = [0..l-1]
  in and $
     zipWith (==) ls $
     map (\p ->
           let i = getIdx p
               j = getJ i p
           in getP i j) ls
  where
    getP i j = (2*i*n-i*i-3*i+2*j-2) `quot` 2
    getJ i p = (2*p+i*i+3*i-2*i*n+2) `quot` 2
    getIdx p = go 0
      where
          go acc | acc == n - 1 = acc
                 | otherwise = if UV.unsafeIndex vec (acc+1) > p
                               then acc
                               else go (acc+1)

main = do
   let vec = getVec 100
   print $ f1 100
   print $ f2 100
   print $ f3 vec 100
   defaultMain
   [bench "f1 100" $ nf f1 100
   ,bench "f2 100" $ nf f2 100
   ,bench "f3 100" $ nf (f3 vec) 100
   ,bench "f3 1000" $ nf (f3 (getVec 1000)) 1000]
$ ghc --make -O2 -fllvm -optl-O3 benchmark.hs
$ ./benchmark
True
True
True
warming up
estimating clock resolution...
mean is 1.296372 us (640001 iterations)
found 3334 outliers among 639999 samples (0.5%)
  3075 (0.5%) high severe
estimating cost of a clock call...
mean is 35.00575 ns (12 iterations)

benchmarking f1 100
mean: 13.92723 ms, lb 13.88566 ms, ub 13.96976 ms, ci 0.950
std dev: 215.6054 us, lb 190.5129 us, ub 246.8802 us, ci 0.950
variance introduced by outliers: 8.472%
variance is slightly inflated by outliers

benchmarking f2 100
mean: 2.810448 ms, lb 2.801007 ms, ub 2.821439 ms, ci 0.950
std dev: 52.27388 us, lb 43.98545 us, ub 65.98971 us, ci 0.950
found 3 outliers among 100 samples (3.0%)
  3 (3.0%) high mild
variance introduced by outliers: 11.350%
variance is moderately inflated by outliers

benchmarking f3 100
mean: 173.9339 us, lb 173.4058 us, ub 174.5147 us, ci 0.950
std dev: 2.829666 us, lb 2.432605 us, ub 3.579531 us, ci 0.950
found 2 outliers among 100 samples (2.0%)
  2 (2.0%) high mild
variance introduced by outliers: 9.410%
variance is slightly inflated by outliers

benchmarking f3 1000
mean: 17.29405 ms, lb 17.26062 ms, ub 17.33314 ms, ci 0.950
std dev: 185.0009 us, lb 157.9185 us, ub 221.9862 us, ci 0.950
Diagrams画直方图————Plot补完计划(一)
这是个蛋疼系列,计划用Diagrams实现所有常用的统计绘图,目的主要是扩充自己的工具箱,绘图时能够摆脱外部的统计软件,并且能根据实际数据需要,方便地自定义修改。代码风格的话,属于想到啥写啥,不会太严谨。
用Diagrams画过一些矢量图以后,发现真正麻烦的地方不是“图形”本身,而是字体、数轴、缩放比例,这些琐碎的东西反而会占据90%以上的代码。以直方图为例,图形本身很简单,差不多1~2行能搞定(第18、19行)。
import           Data.Colour
import           Data.Colour.Names
import qualified Data.Vector.Generic as GV
import qualified Data.Vector.Unboxed as UV
import           Diagrams.Backend.Cairo.CmdLine
import           Diagrams.Prelude
import           Statistics.Distribution
import           Statistics.Distribution.Normal
import qualified Statistics.Sample.Histogram as H
import           System.Random.MWC
import qualified System.Random.MWC.Distributions as R
import           Text.Printf

histogram nBin c vec =
  let (low,up) = H.range nBin vec
      w = (up - low) / fromIntegral nBin
      v = H.histogram_ nBin low up vec ::  UV.Vector Double
      his = alignBL . hcat . map (safeRect w) . GV.toList $ v -- 直方图
      maxH = UV.maximum v
      factorX = maxH / (ratio * (up - low)) -- ratio,图最后的宽:高的比例
      fontS = maxH / 20 -- 字体大小
  in (yAxis maxH fontS ||| strutX (fontS/2) |||
      (his # scaleX factorX === strutY (fontS/2) ===
       xAxis low up fontS factorX))
     # centerXY
  where
    safeRect w h = if h /= 0 -- 0.6版本rect函数,h==0时会报错
                   then rect w h
                        # alignB
                        # fcA c
                   else hrule w
                        # alignB
麻烦的地方开始了,你需要图形的数轴自动标上合适的Label吧,需要图形能自动根据自身的长宽比选择一个合适的缩放比例吧。我发现下面这个unit函数可以比较好的自动选择数轴单位,不会使ticks太密集或者稀疏。fmtStr是和printf配合使用,选择一个合适的数字格式。如此,数轴的其他部分绘制基本就无难度了。
unit :: (Ord a,Floating a) => a -> a -> a
unit low up = last $
              takeWhile (\c -> (up - low) / c >= 4.5) $
              takeWhile (<= (up - low)) $
              concatMap (\c ->  map (10^^c *) [1,2,5])  ([-4..]::[Int])
{-# INLINABLE unit #-}

fmtStr low up | up - low >= 5 = "%.0f"
              | up - low >= 0.5 = "%.1f"
              | up - low >= 0.25 = "%.2f"
              | up - low >= 0.125 = "%.3f"
              | otherwise = error "too small interval"
histogram' nBin (vec,c) (d,c') = -- d : Statistics.Distribution中的Distribution
  let (low,up) = H.range nBin vec
      w = (up - low) / fromIntegral nBin
      v = H.histogram_ nBin low up vec ::  UV.Vector Double
      n = fromIntegral $ GV.length vec
      his = alignBL . hcat . map (safeRect w) . GV.toList $ v
      ls = [low,low+w/2..up]
      maxH = UV.maximum v
      factorX = maxH / (ratio * (up - low))
      fontS = maxH / 20
      vs = fromVertices $ map p2 $ zip ls $ map ((f *) . (density d)) ls
      f = w * n / (cumulative d up - cumulative d low) -- 总面积 / cdf跨过的面积
      funP = vs # stroke # lw (fontS/10) # lcA c' # moveOriginTo (p2 (low,f*(density d low))) -- 与直方图的原点对齐
  in (yAxis maxH fontS ||| strutX (fontS/2) |||
      ((funP <> his) # scaleX factorX === strutY (fontS/2) ===
       xAxis low up fontS factorX))
     # centerXY
  where
    safeRect w h = if h /= 0
                   then rect w h
                        # alignB
                        # fcA c
                   else hrule w
                        # alignB
绘制效果:

所有代码如下:
{-# LANGUAGE NoMonomorphismRestriction #-}
{-# OPTIONS_GHC -fno-warn-missing-signatures #-}
-----------------------------------------------------------------------------
-- |
-- Module : 一些柱状图相关便利函数
-- Copyright : (c) 2012 Boyun Tang
-- License : BSD-style
-- Maintainer : tangboyun@hotmail.com
-- Stability : experimental
-- Portability : ghc
--
--
--
-----------------------------------------------------------------------------
module Main where

import           Data.Colour
import           Data.Colour.Names
import qualified Data.Vector.Generic as GV
import qualified Data.Vector.Unboxed as UV
import           Diagrams.Backend.Cairo.CmdLine
import           Diagrams.Prelude
import           Statistics.Distribution
import           Statistics.Distribution.Normal
import qualified Statistics.Sample.Histogram as H
import           System.Random.MWC
import qualified System.Random.MWC.Distributions as R
import           Text.Printf

ratio = (sqrt 5 - 1) / 2

histogram' nBin (vec,c) (d,c') =
  let (low,up) = H.range nBin vec
      w = (up - low) / fromIntegral nBin
      v = H.histogram_ nBin low up vec ::  UV.Vector Double
      n = fromIntegral $ GV.length vec
      his = alignBL . hcat . map (safeRect w) . GV.toList $ v
      ls = [low,low+w/2..up]
      maxH = UV.maximum v
      factorX = maxH / (ratio * (up - low))
      fontS = maxH / 20
      vs = fromVertices $ map p2 $ zip ls $ map ((f *) . (density d)) ls
      f = w * n / (cumulative d up - cumulative d low)
      funP = vs # stroke # lw (fontS/10) # lcA c' # moveOriginTo (p2 (low,f*(density d low)))
  in (yAxis maxH fontS ||| strutX (fontS/2) |||
      ((funP <> his) # scaleX factorX === strutY (fontS/2) ===
       xAxis low up fontS factorX))
     # centerXY
  where
    safeRect w h = if h /= 0
                   then rect w h
                        # alignB
                        # fcA c
                   else hrule w
                        # alignB


histogram nBin c vec =
  let (low,up) = H.range nBin vec
      w = (up - low) / fromIntegral nBin
      v = H.histogram_ nBin low up vec ::  UV.Vector Double
      his = alignBL . hcat . map (safeRect w) . GV.toList $ v -- 直方图
      maxH = UV.maximum v
      factorX = maxH / (ratio * (up - low)) -- ratio,图最后的宽:高的比例
      fontS = maxH / 20 -- 字体大小
  in (yAxis maxH fontS ||| strutX (fontS/2) |||
      (his # scaleX factorX === strutY (fontS/2) ===
       xAxis low up fontS factorX))
     # centerXY
  where
    safeRect w h = if h /= 0 -- 0.6版本rect函数,h==0时会报错
                   then rect w h
                        # alignB
                        # fcA c
                   else hrule w
                        # alignB

xAxis low up fSize factorX =
  let ls = takeWhile (<= len) [beginAt,beginAt + step..]
      beg = fromIntegral $ (ceiling low :: Int)
      ls' = take (length ls) [beg,beg+step..]
      len = up - low
      step = unit low up
      beginAt = beg - low
      fmt = fmtStr beginAt (last ls)
      ticks = map (\l ->
                    alignT $
                    (vrule (fSize/3) # lw (fSize/20) === strutY (fSize/2) ===
                     text' fSize (printf fmt l))
                  ) ls'
      vs = map p2 $ zip (map (* factorX) ls) (repeat 0)
  in (hrule len # lw (fSize / 10) # alignL) # scaleX factorX <>
     position (zip vs ticks)

yAxis maxH fSize =
  let step = unit 0 maxH
      ls = takeWhile (<= maxH) [step,step+step..]
      fmt = fmtStr step (last ls)
      vs = map p2 $ zip (repeat 0) ls
      ticks = map (\l ->
                    alignR $
                    (text' fSize (printf fmt l) ||| strutX (fSize/2) |||
                     hrule (fSize/3) # lw (fSize/20))
                  ) ls
  in vrule maxH # lw (fSize / 10) # alignB <>
     position (zip vs ticks)


text' h t = text t # fontSize h <> rect (fromIntegral (length t) * 0.6 * h) h # lcA transparent

unit :: (Ord a,Floating a) => a -> a -> a
unit low up = last $
              takeWhile (\c -> (up - low) / c >= 4.5) $
              takeWhile (<= (up - low)) $
              concatMap (\c ->  map (10^^c *) [1,2,5])  ([-4..]::[Int])
{-# INLINABLE unit #-}

fmtStr low up | up - low >= 5 = "%.0f"
              | up - low >= 0.5 = "%.1f"
              | up - low >= 0.25 = "%.2f"
              | up - low >= 0.125 = "%.3f"
              | otherwise = error "too small interval"

main = do
  gen <- create
  randVec <- UV.replicateM 100000 (R.standard gen)
  defaultMain $ do
    histogram' 100 (randVec,blue `withOpacity` 0.8) (normalFromSample randVec, green `withOpacity` 0.8)
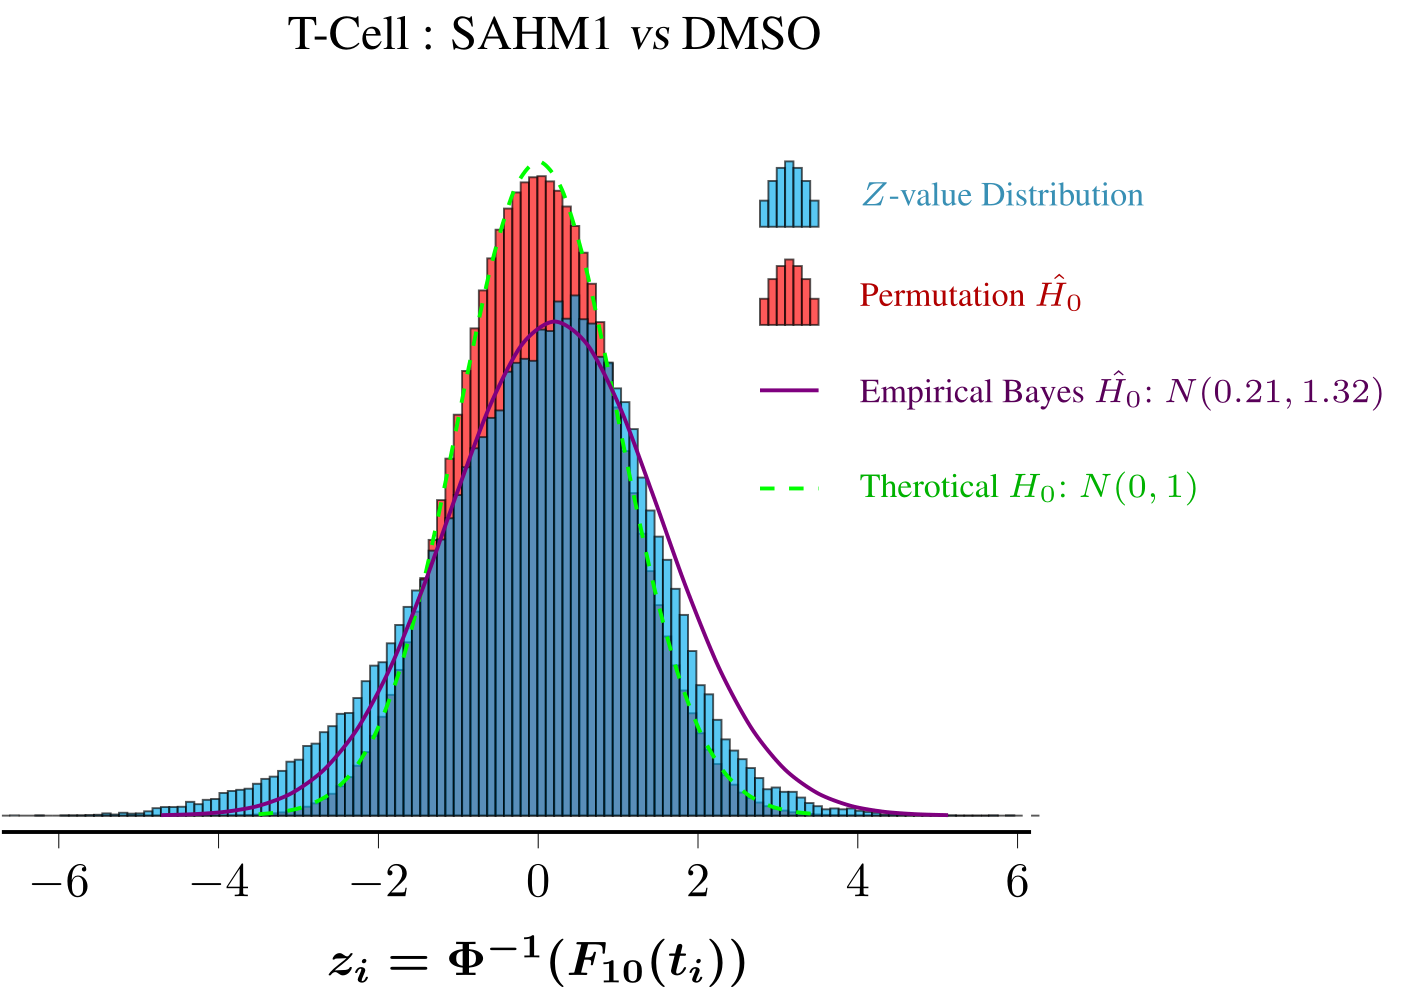
后记:Statistics.Sample.Histogram中的两个histogram函数接口不是很好用,如果只画一层直方图无疑是足够的,但是统计绘图里有时候需要绘制2层直方图(比如实际数据一层、permutation test产生的一层,再加上个经验贝叶斯估计的函数,如下图),它的接口两套数据无法共用一个bin。。。还不如自己写。。。Diagrams目前最大的软肋还是字体处理,这点上估计是没希望超越LaTeX+pgfplots的,下图的其他效果都容易做到,唯独数学字体。。。。。
数据展示与Diagrams库
因为做的是一些数据分析相关的工作,对数据展示格外感兴趣,所以一直在尝试寻找一些好用的低层矢量图形函数库。
尝试过各类数值软件、LaTex的tikz和pgfplots包等。高级的绘图API无疑用起来很方便,但相应的可定制性就较差。tikz和pgfplots是我之前最喜欢用的,不过坏在LaTeX不是个好用的数值软件。之前用Haskell的StringTemplate包写过一个绘制约3w多个点的tex文件,这时候直接用LaTeX编译会爆内存的(LuaLaTeX OK)。用tikz和pgfplots之类的宏包,最强的地方在于完美的数学字体,这方面我仍未发现不通过调用LaTeX能达到相应效果的库。传统的cairo无疑是个很棒的矢量图库,不过太底层,无法想象用裸API能够快速开发。
Haskell的diagrams库,也就是在这里要介绍的,是个很有Haskell风格(各种combinator)的矢量图形库,尝试了一番以后,我非常满意,考虑以后大部分图形函数都移到这库上来。优点主要有以下几点:
- 图是“拼”出来的,而不是传统的一笔一划“画”出来的。
- 后端很丰富,可以导出位图(bmp、png)、矢量(svg、ps、pdf)和tex文件(tikz后端)。
- 表现力很强,语言(DSL)本身很抽象,API设计的也很合理。
- diagrams-core令人惊讶地简洁。
这里就举几个生物上的例子。最近在弄一些microRNA靶基因预测方面的算法,一个预测的靶点好坏,其实可以很直观的看出来的:
- Seed Match的类型(miRNA 5'端的第2~7号碱基与靶的互补情况, 1 based)
- 3’端特定位置的氢键数量
- Seed序列周围的A或U碱基含量百分比
- 靶点的结合区在基因3'UTR区的相对位置。
- 一个比较promising的预测位点应该在不同物种中趋向于保守。
网上的数据库为了展示方便,往往只用文本来展示这类信息,非常不幸的是,如果你没有在浏览器中设置等宽字体,打开我给的那个链接时,你很难直观地看出这些信息。这里“对齐”和“颜色设置”对于良好地展示数据非常重要。


上面这两块svg便是用diagrams绘制的,代码其实很简单(主要琐碎在计算下标和颜色设置上),诀窍是在需要对齐的部分,把字符当块来处理对齐。
-- | 黑白字母
char ch = text [ch] <>
          rect w h # lcA transparent
-- | 彩色字母
charC c ch = text [ch] # fc c <>
             rect w h # lcA transparent

-- | 下面是相应的字串
string = hcat . map char

stringC c = hcat . map (charC c)
想了解microRNA的可以看看下面的文献。另:TargetScan的预测算法在已知结合位置的情况下是相当简单的,大约只有半小时的编程量。
Most Mammalian mRNAs Are Conserved Targets of MicroRNAs
Robin C Friedman, Kyle Kai-How Farh, Christopher B Burge, David P Bartel. Genome Research, 19:92-105 (2009).
简单的图片去背景
上传头像时,想弄个透明背景。图片本身背景很单一,但gimp扣了下发现魔棒效果很差,无法与PS相比。
用Haskell随手写了个小东西,根据亮度来降alpha通道值。一开始还想弄个复杂点的阈值函数,调了几下,发现简单的才是最好的。
module Main where

import System.Environment
import Codec.Picture

main =
  fmap head getArgs >>= readPng >>=
    writePng "out.png" .
    (\(Right (ImageRGBA8 im)) ->
          pixelMap
          (\(PixelRGBA8 r g b al) ->
            let a = (fromIntegral r) +
                    (fromIntegral g) +
                    (fromIntegral b) :: Int
                alpha = if a > ( 3 * 245)
                        then 0
                        else if a > (3*200)
                             then round $
                                  (fromIntegral (a - (3*200)) /
                                   fromIntegral ((3*255)::Int)) * 255
                             else al
            in PixelRGBA8 r g b alpha) im)